



TL;DR
NVIDIA GPU monitoring needs more than a utilization chart. A production design should collect device telemetry with DCGM Exporter, scrape it with Prometheus, visualize fleet and workload behavior in Grafana, and alert on conditions that require action. The runbook must also preserve per-pod context, control metric cardinality, distinguish low utilization from genuine performance problems, and capture enough evidence to support escalation.
The safest implementation path is to use the DCGM Exporter already deployed by NVIDIA GPU Operator when one exists. Deploy a standalone exporter only when the Operator is not managing GPU telemetry. Validate the exporter, ServiceMonitor, Prometheus target, metric set, workload labels, dashboards, and alert rules as separate gates.
Introduction
A GPU can be allocated, visible to a container, and technically healthy while the application using it still performs badly.
That gap is where weak GPU monitoring designs fail. They show that a device exists and may even show a utilization percentage, but they do not explain whether the workload is compute-bound, memory-bound, input-starved, thermally constrained, power-limited, mis-scheduled, or sharing a device with another workload.
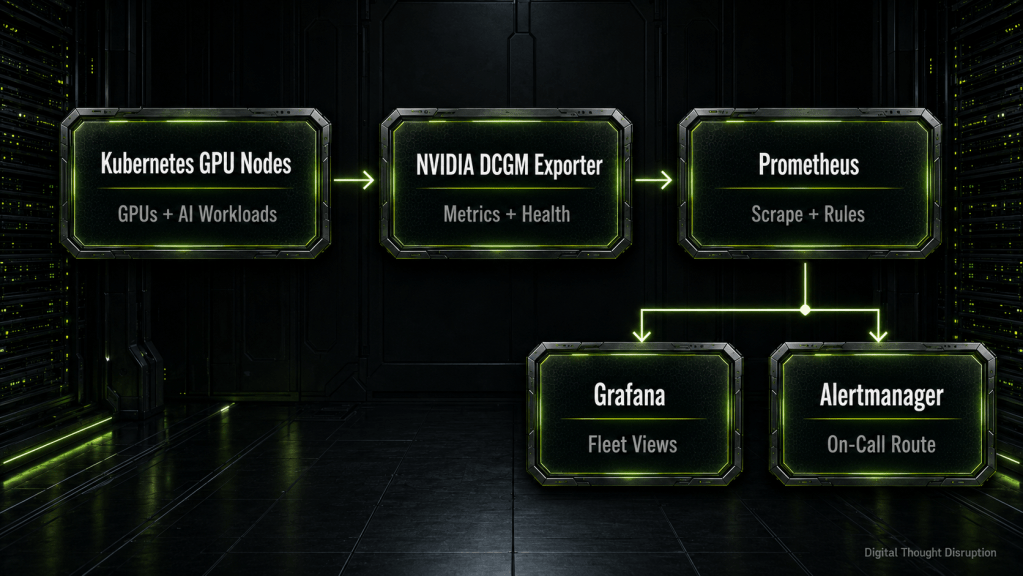
NVIDIA Data Center GPU Manager, commonly shortened to DCGM, provides the device monitoring, health, diagnostics, accounting, and behavioral data behind this operating model. DCGM Exporter converts selected DCGM fields into Prometheus metrics. Prometheus stores and evaluates those metrics, while Grafana presents the fleet, node, GPU, namespace, pod, and workload views operators need during normal operations and incidents.
This article treats the stack as an operational runbook rather than a dashboard installation exercise. The objective is not merely to make graphs appear. The objective is to build a monitoring path that can answer a production question, raise an actionable alert, and produce defensible evidence before an issue is escalated.
Scenario
Assume a Kubernetes platform team operates a mixed GPU cluster that supports model training, inference, notebooks, batch processing, and shared platform services.
The environment may include full GPUs, Multi-Instance GPU profiles, or time-sliced devices. Some teams deploy workloads through standard Deployments, while others use Jobs, queueing systems, notebook controllers, or inference operators. The cluster already has Prometheus and Grafana, but GPU visibility is incomplete or inconsistent.
Common requests arrive in several forms:
- An application team reports that inference latency increased even though the pod is healthy.
- A training job takes longer than expected and appears to use only part of the allocated GPU.
- A GPU node experiences XID events, ECC errors, or pending page retirement.
- Capacity planning shows expensive GPUs allocated for long periods with low effective usage.
- The support team needs a precise evidence package before opening a vendor case.
A good monitoring design must support all of those scenarios without turning Prometheus into an uncontrolled high-cardinality database.
Why This Matters Operationally
GPU incidents cross several ownership boundaries. The platform team owns Kubernetes, the infrastructure team owns GPU nodes and drivers, the application team owns model code and data pipelines, and another team may own Prometheus, Grafana, or on-call routing.
Without a shared telemetry model, every team sees a different fragment of the problem.
The application team sees slow requests. Kubernetes sees a Running pod. The GPU node sees memory allocated. DCGM may show low engine activity, power throttling, XID events, or a rising hardware error counter. Prometheus may have the data, but a dashboard that aggregates everything at cluster level can hide the affected device and workload.
The monitoring stack therefore needs to preserve four layers of context:
| Layer | Questions the monitoring design must answer |
|---|---|
| Fleet | Which nodes, GPUs, exporters, and Prometheus targets are healthy? |
| Device | What are utilization, memory, temperature, power, clocks, errors, and throttling signals for this GPU or MIG instance? |
| Workload | Which namespace, pod, container, application, team, or job is associated with the device? |
| Service | Did workload throughput, latency, queue depth, or job completion time change at the same time? |
DCGM Exporter covers the GPU and part of the workload layer. It does not replace application metrics, request traces, storage monitoring, network telemetry, or scheduler visibility. The most useful Grafana dashboard places GPU behavior beside the service indicators that explain whether that behavior is good or bad.
Symptoms and Risks
Before changing the monitoring stack, confirm the failure mode. The remediation for a missing exporter is different from the remediation for a label mismatch, unsupported metric, or overloaded Prometheus server.
| Symptom | Likely cause | Operational risk |
|---|---|---|
| No DCGM metrics anywhere | Exporter missing, exporter failing, GPU runtime unavailable, or Prometheus not scraping | Hardware and workload incidents are invisible |
| Exporter pods are Running but Prometheus has no target | ServiceMonitor is not selected, Service labels do not match, namespace selection is wrong, or CRD is missing | False confidence because collection appears deployed |
| Fleet metrics exist but pod labels are empty | Kubernetes mapping disabled, kubelet pod-resources path unavailable, workload no longer owns the GPU, or metadata enrichment not enabled | Operators cannot identify the affected workload |
| Utilization exists but ECC or retired-page metrics do not | Collector file does not include those fields, hardware does not support them, or field names differ by DCGM release | Hardware degradation may not trigger alerts |
| Grafana shows duplicate or confusing per-pod values | Time-slicing, shared devices, duplicated labels, or incorrect aggregation | Teams may treat device-wide activity as isolated pod accounting |
| Prometheus memory or storage grows rapidly | Too many pod labels, unstable label values, short-lived workloads, or excessive scrape frequency | Monitoring becomes its own reliability problem |
| Low utilization alert fires constantly | Alert ignores workload schedule, queue depth, application throughput, or intentional idle periods | Alert fatigue and wasted investigation effort |
The first safety principle is simple: do not add another exporter until you know whether NVIDIA GPU Operator already manages one.
GPU Telemetry Architecture
The important point in the following design is that DCGM Exporter runs near the GPU, while Prometheus, Grafana, and alerting remain shared platform services. Kubernetes metadata enrichment connects device telemetry to the pod that holds the GPU allocation.
DCGM Exporter can run with an embedded host engine or connect to an existing DCGM host engine. Appliances and systems that already run nv-hostengine require special care because the DCGM client in the exporter must remain compatible with the host engine. Treat that as a version-controlled integration, not a casual container replacement.
Prerequisites and Safety Checks
Complete these checks before changing the cluster.
Confirm the GPU Software Path
Verify that the GPU is visible on each target node and that Kubernetes can allocate it.
kubectl get nodes -L nvidia.com/gpu.present,nvidia.com/gpu.count,nvidia.com/mig.config
kubectl get pods -A -o wide | grep -E 'nvidia|gpu'
kubectl get daemonset -A | grep -E 'dcgm|nvidia'
Where NVIDIA GPU Operator is installed, also confirm the ClusterPolicy resource.
kubectl get clusterpolicy
On a representative GPU node, capture the driver and device state through your approved privileged administration method.
nvidia-smi
nvidia-smi -L
Successful output should list the expected GPU or MIG devices without driver communication errors.
Confirm the Existing Monitoring Stack
Identify the Prometheus implementation, Operator release, namespace, and ServiceMonitor selection behavior.
kubectl get crd servicemonitors.monitoring.coreos.com
kubectl get prometheus -A
kubectl get servicemonitor -A
kubectl get prometheusrule -A
helm list -A | grep -E 'prometheus|grafana|gpu-operator|dcgm'
Do not assume that every ServiceMonitor is automatically selected. Prometheus resources can filter ServiceMonitors by label and namespace. Record the selector before creating or changing telemetry resources.
kubectl get prometheus -A -o yaml | grep -A12 -E 'serviceMonitorSelector|serviceMonitorNamespaceSelector'
Capture a Rollback Baseline
Export the current Helm values and Kubernetes objects before change.
helm get values "$GPU_OPERATOR_RELEASE" -n "$GPU_OPERATOR_NAMESPACE" -o yaml \
  > gpu-operator-values-before.yaml

kubectl get clusterpolicy -o yaml > clusterpolicy-before.yaml
kubectl get servicemonitor -A -o yaml > servicemonitors-before.yaml
kubectl get prometheusrule -A -o yaml > prometheusrules-before.yaml
Replace the environment variables with the actual release and namespace. If GPU Operator is not installed, omit those commands and capture the standalone exporter resources instead.
Define the Observation Window
Choose a known workload and record:
- expected start and end time
- namespace, workload, pod, and container
- GPU UUID or MIG instance
- expected throughput, latency, batch size, or job duration
- whether the GPU is exclusively allocated, partitioned, or time-sliced
- application owner and escalation path
This baseline prevents the team from interpreting normal idle time as a platform problem.
Runbook Stage: Choose the Correct Deployment Path
There are two valid patterns, but only one should manage the exporter on a given GPU node.
Use GPU Operator Integration When the Operator Is Present
A default GPU Operator installation deploys DCGM Exporter on GPU worker nodes. Confirm the existing DaemonSet before changing Helm values.
kubectl get daemonset -A | grep dcgm-exporter
kubectl get pods -A -l app=nvidia-dcgm-exporter -o wide
kubectl get service -A | grep dcgm-exporter
kubectl get servicemonitor -A | grep dcgm
Label keys can vary across releases, so use kubectl get daemonset -A --show-labels when the label selector returns no results.
For an Operator-managed deployment, preserve the existing release values and add only the required telemetry settings through the same Helm or GitOps workflow that owns the Operator.
dcgmExporter:
  enabled: true
  serviceMonitor:
    enabled: true
    interval: 15s
    scrapeTimeout: 10s
    additionalLabels:
      release: kube-prometheus-stack
  enablePodLabels: true
  enablePodUID: true
  podLabelAllowlistRegex:
    - "^app\\.kubernetes\\.io/(name|instance|component)$"
    - "^team$"
    - "^environment$"
Change the release label to the value selected by your Prometheus instance. Do not copy the example blindly. In some environments, Prometheus accepts ServiceMonitors without an additional release label.
Apply the values through the controlled release process.
helm upgrade "$GPU_OPERATOR_RELEASE" nvidia/gpu-operator \
  -n "$GPU_OPERATOR_NAMESPACE" \
  --reuse-values \
  -f gpu-operator-monitoring-values.yaml \
  --version "$GPU_OPERATOR_CHART_VERSION"
Pin the chart version already approved for the environment. Do not introduce an Operator upgrade as an unplanned side effect of enabling monitoring.
Install Standalone DCGM Exporter When GPU Operator Does Not Manage It
Use the standalone chart only when no Operator-managed exporter exists on those nodes.
export DCGM_EXPORTER_HELM_REPO="" export DCGM_EXPORTER_CHART_VERSION=" " helm repo add gpu-helm-charts "$DCGM_EXPORTER_HELM_REPO" helm repo update helm upgrade --install dcgm-exporter gpu-helm-charts/dcgm-exporter \ --namespace gpu-monitoring \ --create-namespace \ --version "$DCGM_EXPORTER_CHART_VERSION" \ -f dcgm-exporter-values.yaml
A production values file should define scrape behavior, resource requests, node placement, pod metadata policy, and the exact metric collector set.
serviceMonitor:
  enabled: true
  interval: 15s
  scrapeTimeout: 10s
  additionalLabels:
    release: kube-prometheus-stack

resources:
  requests:
    cpu: 100m
    memory: 128Mi
  limits:
    cpu: 500m
    memory: 512Mi

kubernetes:
  enablePodLabels: true
  enablePodUID: true
  podLabelAllowlistRegex:
    - "^app\\.kubernetes\\.io/(name|instance|component)$"
    - "^team$"
    - "^environment$"

nodeSelector:
  nvidia.com/gpu.present: "true"
The chart already tolerates common GPU node taints in many releases, but verify the rendered DaemonSet against your own node taints.
helm template dcgm-exporter gpu-helm-charts/dcgm-exporter \
  --namespace gpu-monitoring \
  --version "$DCGM_EXPORTER_CHART_VERSION" \
  -f dcgm-exporter-values.yaml \
  > rendered-dcgm-exporter.yaml

kubectl apply --dry-run=server -f rendered-dcgm-exporter.yaml
Successful validation means the manifests are accepted by the API server and schedule only on intended GPU nodes.
Runbook Stage: Configure a Health-Focused Metric Set
DCGM Exporter reads a collector definition that specifies which DCGM fields become Prometheus metrics. The default set is useful, but operators should inspect it rather than assume every health field is enabled.
A controlled collector set can include utilization, memory, temperature, power, clocks, XID, ECC, retired pages, remapped rows, and selected profiling fields.
customMetrics: |
  # Core utilization and memory
  DCGM_FI_DEV_GPU_UTIL, gauge, GPU utilization in percent.
  DCGM_FI_DEV_MEM_COPY_UTIL, gauge, Memory copy utilization in percent.
  DCGM_FI_DEV_FB_USED, gauge, Framebuffer memory used in MiB.
  DCGM_FI_DEV_FB_FREE, gauge, Framebuffer memory free in MiB.

  # Temperature, power, and clocks
  DCGM_FI_DEV_GPU_TEMP, gauge, GPU temperature in Celsius.
  DCGM_FI_DEV_MEMORY_TEMP, gauge, Memory temperature in Celsius.
  DCGM_FI_DEV_POWER_USAGE, gauge, Board power draw in watts.
  DCGM_FI_DEV_SM_CLOCK, gauge, SM clock frequency in MHz.
  DCGM_FI_DEV_MEM_CLOCK, gauge, Memory clock frequency in MHz.

  # Device and transport health
  DCGM_FI_DEV_XID_ERRORS, gauge, Last XID error observed.
  DCGM_FI_DEV_PCIE_REPLAY_COUNTER, counter, Total PCIe replay count.
  DCGM_FI_DEV_ECC_SBE_VOL_TOTAL, counter, Volatile single-bit ECC errors.
  DCGM_FI_DEV_ECC_DBE_VOL_TOTAL, counter, Volatile double-bit ECC errors.
  DCGM_FI_DEV_ECC_SBE_AGG_TOTAL, counter, Aggregate single-bit ECC errors.
  DCGM_FI_DEV_ECC_DBE_AGG_TOTAL, counter, Aggregate double-bit ECC errors.
  DCGM_FI_DEV_RETIRED_SBE, counter, Pages retired for single-bit errors.
  DCGM_FI_DEV_RETIRED_DBE, counter, Pages retired for double-bit errors.
  DCGM_FI_DEV_RETIRED_PENDING, counter, Pages pending retirement.
  DCGM_FI_DEV_UNCORRECTABLE_REMAPPED_ROWS, counter, Uncorrectable remapped rows.
  DCGM_FI_DEV_CORRECTABLE_REMAPPED_ROWS, counter, Correctable remapped rows.
  DCGM_FI_DEV_ROW_REMAP_FAILURE, gauge, Row remapping failure state.

  # Throttling and workload behavior
  DCGM_FI_DEV_POWER_VIOLATION, counter, Time throttled by power constraint.
  DCGM_FI_DEV_THERMAL_VIOLATION, counter, Time throttled by thermal constraint.
  DCGM_FI_DEV_RELIABILITY_VIOLATION, counter, Time throttled by reliability constraint.
  DCGM_FI_PROF_GR_ENGINE_ACTIVE, gauge, Ratio of time the graphics engine is active.
  DCGM_FI_PROF_PIPE_TENSOR_ACTIVE, gauge, Ratio of tensor pipe cycles active.
  DCGM_FI_PROF_DRAM_ACTIVE, gauge, Ratio of time the device memory interface is active.
The exact chart key used to supply custom metrics depends on the deployment path and chart release. In the current standalone chart, customMetrics replaces the complete default collector list. It is not additive. Preserve every default metric you still need.
Some fields are hardware-dependent. A missing ECC, temperature, profiling, or interconnect series does not automatically mean the exporter is broken. Confirm support for the installed GPU model and DCGM release before treating absence as a collection failure.
Profiling fields can require elevated container capabilities. Treat changes to security context as a security review item, not merely a monitoring tweak.
Runbook Stage: Validate the ServiceMonitor
A ServiceMonitor tells Prometheus Operator which Kubernetes Service to discover and which named port to scrape. Three selectors must align:
- the Prometheus resource must select the ServiceMonitor
- the ServiceMonitor must select the DCGM Exporter Service
- the endpoint port name must match the Service port name
Inspect the live objects first.
kubectl get service -A | grep dcgm
kubectl get servicemonitor -A | grep dcgm
kubectl describe servicemonitor -n gpu-monitoring dcgm-exporter
kubectl get service -n gpu-monitoring dcgm-exporter -o yaml
When the chart does not create a ServiceMonitor, use a manifest like the following and modify every label to match the live Service and Prometheus selectors.
apiVersion: monitoring.coreos.com/v1
kind: ServiceMonitor
metadata:
  name: dcgm-exporter
  namespace: gpu-monitoring
  labels:
    release: kube-prometheus-stack
spec:
  namespaceSelector:
    matchNames:
      - gpu-monitoring
  selector:
    matchLabels:
      app.kubernetes.io/name: dcgm-exporter
  endpoints:
    - port: metrics
      path: /metrics
      interval: 15s
      scrapeTimeout: 10s
The value under endpoints.port is a Service port name, not the number 9400. A mismatched name is one of the most common reasons an apparently correct ServiceMonitor produces no targets.
Apply and inspect the object.
kubectl apply -f dcgm-exporter-servicemonitor.yaml
kubectl get servicemonitor -n gpu-monitoring dcgm-exporter -o yaml
kubectl get endpointslice -n gpu-monitoring -l kubernetes.io/service-name=dcgm-exporter
A healthy configuration should show one endpoint for each intended exporter pod.
Runbook Stage: Prove Metrics Reach Prometheus
Validate each hop separately rather than jumping directly to Grafana.
Validate the Exporter Endpoint
Port-forward one exporter Service or pod through an approved administration session.
kubectl port-forward -n "$DCGM_NAMESPACE" service/"$DCGM_SERVICE" 9400:9400
From the same workstation, inspect representative metrics.
curl -s localhost:9400/metrics | grep -E \
  'DCGM_FI_DEV_GPU_UTIL|DCGM_FI_DEV_FB_USED|DCGM_FI_DEV_GPU_TEMP|DCGM_FI_DEV_XID_ERRORS'
Expected output includes Prometheus samples with labels such as GPU index, UUID, hostname, and, when a workload owns the device, Kubernetes namespace, pod, and container metadata.
Validate the Prometheus Target
In the Prometheus targets view, confirm that the DCGM Exporter target is UP. Then query a known metric.
DCGM_FI_DEV_GPU_UTIL
Use a specific GPU UUID or node label when many series exist.
DCGM_FI_DEV_GPU_UTIL{UUID=""}
If the exporter endpoint works but Prometheus has no series, inspect:
- ServiceMonitor labels
- Service labels
- namespace selectors
- endpoint port name
- NetworkPolicy
- Prometheus target discovery
- TLS or authentication configuration
- scrape timeout
Do not troubleshoot Grafana until this gate passes.
Runbook Stage: Build the Grafana Dashboard
Grafana has native Prometheus support. The dashboard should be designed around operator decisions, not around the number of available metrics.
Create Useful Dashboard Variables
Recommended variables include:
- cluster
- namespace
- node or
Hostname - GPU UUID
- GPU index
- MIG profile and instance identifiers
- pod
- application
- team
- environment
Use low-cardinality, controlled labels for variables. Avoid pod UID as a primary human-facing selector unless it is needed for incident precision.
Build the Dashboard in Operational Rows
| Dashboard row | Recommended panels | Operator question |
|---|---|---|
| Fleet coverage | exporter targets, GPU count, missing nodes, scrape duration | Are all intended devices being monitored? |
| Utilization | GPU utilization, graphics engine active, tensor activity, DRAM activity | Is the GPU executing useful work, and what resource is active? |
| Memory | used, free, utilization percentage, allocation by workload | Is memory pressure limiting the workload, or is memory allocated while compute is idle? |
| Thermals and power | GPU temperature, memory temperature, power draw, violation counters | Is the device approaching a thermal or power constraint? |
| Clocks | SM clock, memory clock, clock changes alongside load | Are clocks behaving as expected for the workload and power state? |
| Hardware health | XID, ECC, retired pages, remapped rows, PCIe replays | Is this an application issue or a device or transport issue? |
| Workload attribution | top namespaces, pods, applications, teams, MIG instances | Who owns the activity and who should be engaged? |
| Service correlation | latency, throughput, queue depth, batch size, job progress | Did GPU behavior affect the service outcome? |
Use PromQL That Preserves Device Context
GPU utilization over a five-minute window:
avg_over_time(DCGM_FI_DEV_GPU_UTIL[5m])
Framebuffer memory usage percentage:
100 * DCGM_FI_DEV_FB_USED
/
(DCGM_FI_DEV_FB_USED + DCGM_FI_DEV_FB_FREE)
GPU temperature by node and device:
max by (Hostname, gpu, UUID) (DCGM_FI_DEV_GPU_TEMP)
Average power draw:
avg_over_time(DCGM_FI_DEV_POWER_USAGE[5m])
Per-pod memory allocation:
sum by (namespace, pod, container) (
  DCGM_FI_DEV_FB_USED{pod!=""}
)
Top workloads by average GPU utilization:
topk(
  10,
  avg_over_time(DCGM_FI_DEV_GPU_UTIL{pod!=""}[15m])
)
These queries assume the exporter emits the referenced labels. Inspect a live series before building variables or aggregations.
Per-Pod and Per-Workload Visibility
DCGM Exporter can use the kubelet pod-resources interface to associate an allocated GPU with Kubernetes workload metadata. Newer GPU Operator releases also support optional pod label and pod UID enrichment.
That capability is useful, but it requires discipline.
Allowlist Stable Business Labels
Good label dimensions include:
- application name
- application instance
- component
- team
- environment
- workload class
- queue or service tier when values are controlled
Avoid labels containing request IDs, build hashes, timestamps, arbitrary user values, or other rapidly changing identifiers. Every distinct label set becomes a new Prometheus time series.
Understand Shared GPU Attribution
Per-pod labels do not magically convert a device-level counter into perfect per-process accounting.
- Exclusive full GPU allocation: Device telemetry usually maps cleanly to the owning pod.
- MIG: Metrics can be exposed for individual GPU instances, which improves isolation and attribution.
- Time-slicing: Multiple pods may share one physical GPU, while many DCGM metrics remain device-level. Do not interpret duplicated labels as exact per-pod usage.
- Short-lived Jobs: Pod labels improve incident tracing but can create high series churn.
For chargeback or precise workload accounting, combine DCGM telemetry with scheduler records, job metadata, application metrics, and platform allocation data.
Alert Thresholds That Produce Action
Alerts should identify conditions that require an operator response. Dashboards can carry far more detail than paging rules.
Use the following as starting guidance, then calibrate against the GPU model, workload pattern, thermal design, and service-level objectives.
| Signal | Starting condition | Severity guidance | Required action |
|---|---|---|---|
| Exporter target missing | Target down for 5 minutes | Critical when node is expected in service | Confirm pod, Service, ServiceMonitor, network, and driver state |
| Uncorrectable ECC | Any increase in double-bit error counter | Critical | Quarantine affected workload and follow hardware runbook |
| Pending retired pages | Value greater than zero | Critical | Preserve evidence, drain when required, assess reset or replacement path |
| Row remap failure | Value greater than zero | Critical | Escalate as hardware health issue |
| New XID event | New non-zero event within observation window | Warning or critical by XID class | Correlate kernel log, workload, and recovery guidance |
| Sustained high temperature | Above model-approved warning threshold for 10 minutes | Warning | Check airflow, fan state, neighboring load, and clocks |
| Thermal violation increase | Counter increases during workload | Warning or critical if service affected | Determine whether throttling explains performance degradation |
| Power violation increase | Counter increases during workload | Warning | Check configured power cap, clocks, workload demand, and facility policy |
| Sustained low utilization | Below workload baseline for 30 minutes while a job is expected to run | Informational or ticket, not page | Investigate workload concurrency, CPU, storage, network, batching, and synchronization |
| Memory near capacity | Above tested workload threshold for 10 minutes | Warning | Check batch size, model footprint, fragmentation, and eviction risk |
Temperature thresholds should be based on model-specific limits and local policy. A fixed cluster-wide number can be too conservative for one platform and too aggressive for another.
Example Prometheus Rules
The following rule set demonstrates the structure. Modify labels, thresholds, and hardware fields to match the collected metric set.
apiVersion: monitoring.coreos.com/v1
kind: PrometheusRule
metadata:
  name: nvidia-gpu-health
  namespace: monitoring
  labels:
    release: kube-prometheus-stack
spec:
  groups:
    - name: nvidia-gpu-health
      rules:
        - alert: NvidiaGpuHighTemperature
          expr: DCGM_FI_DEV_GPU_TEMP > 85
          for: 10m
          labels:
            severity: warning
            team: platform
          annotations:
            summary: NVIDIA GPU temperature is above the provisional threshold
            description: Review model-specific temperature limits, cooling, clocks, and workload impact.

        - alert: NvidiaGpuUncorrectableEccError
          expr: increase(DCGM_FI_DEV_ECC_DBE_AGG_TOTAL[15m]) > 0
          labels:
            severity: critical
            team: platform
          annotations:
            summary: NVIDIA GPU reported an uncorrectable ECC error
            description: Preserve evidence and follow the hardware isolation runbook.

        - alert: NvidiaGpuRetiredPagePending
          expr: DCGM_FI_DEV_RETIRED_PENDING > 0
          for: 5m
          labels:
            severity: critical
            team: platform
          annotations:
            summary: NVIDIA GPU has a page pending retirement
            description: Review ECC history, row remap state, workload impact, and recovery requirements.

        - alert: NvidiaGpuThermalThrottling
          expr: increase(DCGM_FI_DEV_THERMAL_VIOLATION[10m]) > 0
          labels:
            severity: warning
            team: platform
          annotations:
            summary: NVIDIA GPU thermal throttling increased
            description: Correlate temperature, clocks, power, node cooling, and application performance.
Use for durations to avoid paging on brief transients. Validate rule syntax before promotion.
promtool check rules nvidia-gpu-rules.yaml
kubectl apply --dry-run=server -f nvidia-gpu-rules.yaml
Where possible, test rules against recorded production-like series before enabling notifications.
Diagnosing Low GPU Utilization
Low utilization is a symptom, not a root cause. It can indicate a problem, but it can also represent a bursty service, a completed batch, intentional headroom, or a workload waiting for external input.
Use the following decision path.
Confirm the Workload Owns the GPU
kubectl get pod -n "$NAMESPACE" "$POD" -o yaml | grep -A8 -E 'resources:|nvidia.com/gpu'
kubectl describe pod -n "$NAMESPACE" "$POD"
Check for pending scheduling, missing resource requests, unexpected MIG profile, device-plugin errors, or a completed workload that still appears in a dashboard time range.
Correlate Utilization with Memory
High memory allocation with low compute activity often points to one of these conditions:
- model loaded but requests are not arriving
- batch size or concurrency is too small
- CPU preprocessing cannot feed the device
- storage or network input is slow
- the application is waiting at synchronization barriers
- another service owns the request queue
- kernels are too small or fragmented to keep the device active
Compare DCGM_FI_DEV_GPU_UTIL, DCGM_FI_PROF_GR_ENGINE_ACTIVE, DCGM_FI_PROF_DRAM_ACTIVE, framebuffer memory, application throughput, request queue depth, and CPU utilization over the same time range.
Check for Power or Thermal Constraints
A workload can show moderate utilization while running slower than expected because clocks are reduced.
Correlate:
- GPU and memory temperature
- SM and memory clocks
- board power draw
- thermal violation counter
- power violation counter
- reliability violation counter
- node fan, cooling, and facility alerts
Do not conclude that the application is inefficient until throttling is ruled out.
Check the Workload Shape
For inference services, inspect request concurrency, dynamic batching, queue wait time, model instances, CPU thread pools, and upstream rate limits.
For training, inspect data-loader workers, storage throughput, network fabric, gradient synchronization, collective communication, checkpoint activity, and batch size.
For notebooks, low utilization may simply mean interactive use. Capacity policy should distinguish a reserved development GPU from a production service expected to sustain throughput.
Validation Steps
The monitoring implementation is complete only when each validation gate passes.
Exporter Validation
kubectl get pods -A -o wide | grep dcgm-exporter
kubectl logs -n "$DCGM_NAMESPACE" daemonset/"$DCGM_DAEMONSET" --tail=200
Pass criteria:
- one healthy exporter pod on every intended GPU node
- no repeated host-engine, driver, permission, or kubelet pod-resources errors
- resource usage remains within configured requests and limits
Metric Validation
Run a known GPU workload and confirm these series change:
- GPU utilization
- framebuffer used and free
- power draw
- temperature
- clocks
- at least one engine or profiling metric when supported
- namespace, pod, and container labels when exclusive allocation is used
Hardware health counters should remain stable in a healthy test. Do not inject errors into production merely to prove an alert.
Prometheus Validation
Pass criteria:
- every expected target is
UP - scrape duration remains below scrape timeout
- sample count and series growth are acceptable
- retention and storage growth remain within platform limits
- rules load without evaluation errors
Grafana Validation
Pass criteria:
- variables filter to the correct node, GPU, namespace, and pod
- dashboard panels retain GPU UUID and workload identity
- no panel silently aggregates healthy and unhealthy devices together
- missing metrics are shown as unavailable, not zero
- time range and timezone are clear during incident review
Alert Validation
Test notification routing with a safe synthetic rule or approved test condition. Confirm:
- severity routes to the correct receiver
- alert annotations identify node, GPU UUID, namespace, and pod when available
- runbook ownership is clear
- resolved notifications work as intended
- maintenance silences do not suppress unrelated GPU incidents
Collecting Evidence Before Escalation
A vendor or infrastructure escalation should contain enough data to identify the device, reproduce the timeline, and separate application behavior from hardware health.
Collect the following before draining, rebooting, resetting, or replacing anything, unless immediate containment is required.
Incident Identity
- incident start time, timezone, and duration
- affected cluster, node, namespace, workload, pod, and container
- GPU model, index, UUID, and MIG profile when applicable
- user-visible impact such as latency, failed requests, job delay, or data corruption risk
- whether the condition cleared, persisted, or returned
Software and Platform State
kubectl version
helm list -A | grep -E 'gpu-operator|dcgm|prometheus|grafana'
kubectl get clusterpolicy -o yaml
kubectl get pods -A -o wide | grep -E 'dcgm|nvidia'
nvidia-smi
nvidia-smi -q
Capture the NVIDIA driver, CUDA compatibility view, GPU Operator chart, DCGM Exporter image, Kubernetes version, container runtime, and relevant workload image.
Workload and Kubernetes Evidence
kubectl get pod -n "$NAMESPACE" "$POD" -o yaml
kubectl describe pod -n "$NAMESPACE" "$POD"
kubectl logs -n "$NAMESPACE" "$POD" --all-containers --timestamps
kubectl get events -n "$NAMESPACE" --sort-by=.lastTimestamp
kubectl describe node "$NODE"
Include resource requests, limits, scheduling events, restarts, exit codes, node pressure, and device-plugin messages.
GPU and Kernel Evidence
nvidia-smi -q -x > nvidia-smi-q.xml
dcgmi discovery -l > dcgm-discovery.txt
dcgmi health -c > dcgm-health.txt
dcgmi -v > dcgmi-version.txt
sudo nvidia-bug-report.sh
journalctl -k --since "$INCIDENT_START" > kernel-incident.log
Run active DCGM diagnostics only under the approved maintenance procedure. Diagnostic workloads can stress GPUs and interfere with production applications. Drain or isolate the device first when the test requires exclusive access.
Time-Series Evidence
Export or capture a consistent time window that includes at least:
- 30 minutes before the incident
- the complete incident period
- 30 minutes after recovery or containment
Include raw or exported data for:
- GPU utilization and engine activity
- memory used and free
- temperature and power
- SM and memory clocks
- XID and ECC signals
- retired pages and row remapping
- PCIe or NVLink errors when relevant
- application latency, throughput, queue depth, and error rate
- CPU, storage, network, and node pressure
A screenshot is useful for context, but raw query data is stronger evidence because it preserves values, labels, timestamps, and device identity.
Rollback and Fallback Guidance
Monitoring changes should be reversible without deleting historical data.
Roll Back a Helm Change
Inspect release history and return to the last known-good revision.
helm history "$RELEASE" -n "$NAMESPACE"
helm rollback "$RELEASE" "$REVISION" -n "$NAMESPACE"
Validate exporter pods and Prometheus targets after rollback.
Restore the Previous Collector Set
If custom metrics create unsupported-field errors, excessive scrape time, or unexpected cardinality, restore the prior values file or collector ConfigMap. Remember that a custom collector can replace the entire default set, so rollback must restore the complete previous list.
Disable Metadata Enrichment Without Disabling Device Monitoring
When pod label enrichment causes cardinality growth, first disable enablePodLabels or tighten podLabelAllowlistRegex. Preserve base device telemetry while the label policy is corrected.
Remove a Duplicate Standalone Exporter
When GPU Operator already manages DCGM Exporter, remove the unintended standalone release after confirming the Operator-managed targets are healthy.
helm uninstall dcgm-exporter -n gpu-monitoring
kubectl get daemonset -A | grep dcgm-exporter
Fallback When Prometheus Operator Is Unavailable
DCGM Exporter still exposes a Prometheus-formatted endpoint. A temporary static scrape configuration can be used where platform policy permits, but the long-term design should return to declarative target discovery and controlled rule management.
Do not disable GPU health monitoring as a troubleshooting shortcut. Replace a failing collection path with a validated fallback and document the visibility gap.
Operational Handoff Checklist
Before handing the stack to operations, confirm:
- GPU Operator or standalone exporter ownership is documented
- chart and image versions are pinned through the platform release process
- ServiceMonitor selection rules are recorded
- custom collector fields are version-controlled
- pod label allowlists are approved
- Prometheus series growth has been measured
- dashboard ownership and folder permissions are defined
- alert thresholds have workload and hardware context
- each alert links to an internal runbook in the monitoring platform
- evidence retention meets support and incident-review needs
- active DCGM diagnostic procedures require an approved maintenance state
- rollback values and previous collector files are retained
The monitoring stack is ready when another operator can identify the affected GPU and workload, determine whether the problem is collection, scheduling, application behavior, throttling, or hardware health, and preserve evidence without relying on the person who built the dashboard.
Conclusion
DCGM Exporter, Prometheus, and Grafana provide a strong foundation for NVIDIA GPU observability, but the technology only becomes operationally useful when the collection path is treated as a controlled system.
Start by choosing one exporter owner per GPU node. Reuse the GPU Operator integration when it exists. Validate the ServiceMonitor and Prometheus target before building dashboards. Select a metric set that includes the hardware health indicators your support model requires, and do not assume disabled ECC or retired-page fields are already available.
Build Grafana around fleet coverage, device behavior, workload attribution, and service outcomes. Use pod metadata carefully, especially in time-sliced environments where device-wide metrics should not be presented as precise per-pod accounting. Alert on conditions that lead to action, while keeping low utilization primarily as a diagnostic and capacity signal.
Most importantly, define the evidence package before the incident. GPU UUIDs, workload identity, software versions, DCGM health, kernel logs, time-series data, and application impact are what turn a vague performance complaint into a supportable engineering case.
