



TL;DR
NVIDIA Triton Inference Server performance tuning is not a matter of enabling dynamic batching and increasing model instances until GPU utilization rises. The correct process is to define a latency objective, establish a repeatable baseline, test realistic concurrency and arrival patterns, inspect queue and compute time separately, and then promote only configurations that improve throughput without violating tail-latency or memory limits.
For stateless models, dynamic batching is usually the first scheduler to evaluate. For stateful models, sequence batching is required to preserve sequence affinity. Model instance counts, CPU and GPU placement, request queue delay, and concurrent model execution should then be tested together because each setting changes both resource usage and request behavior. Perf Analyzer measures the service under load, while Model Analyzer helps search the configuration space and identify candidate configurations that meet defined constraints.
Introduction
A Triton deployment can be healthy, fully loaded, and still perform badly for the workload that matters.
The most common mistake is to treat GPU utilization as the objective. High utilization can be useful, but it does not tell you whether requests are spending too long in the scheduler queue, whether p99 latency is rising during bursts, whether model instances are competing for memory bandwidth, or whether an aggressive batching delay is quietly consuming the application latency budget.
The real objective is workload-specific. An online recommendation API may need a strict p99 latency boundary. A document-processing service may accept more latency in exchange for higher throughput. A multi-model inference node may need to protect memory headroom and prevent one model from degrading another. Triton provides the schedulers and execution controls to support these goals, but the correct configuration must be measured against the actual service objective.
This tutorial builds that tuning process from the model repository through production promotion and rollback.
What You Will Accomplish
By the end of this tutorial, you will be able to:
- Build a versioned Triton model repository that supports repeatable testing and rollback.
- Configure model instances and place them on selected GPUs or CPUs.
- Choose between dynamic batching and sequence batching.
- Tune scheduler delay without hiding queue saturation.
- Test concurrent model execution with realistic client behavior.
- Use Perf Analyzer to separate client latency, server queue time, and compute time.
- Use Model Analyzer to search candidate batch and instance configurations.
- Select a throughput and latency operating point rather than chasing one maximum number.
- Promote and roll back a Triton configuration using explicit validation gates.
How Requests Move Through Triton
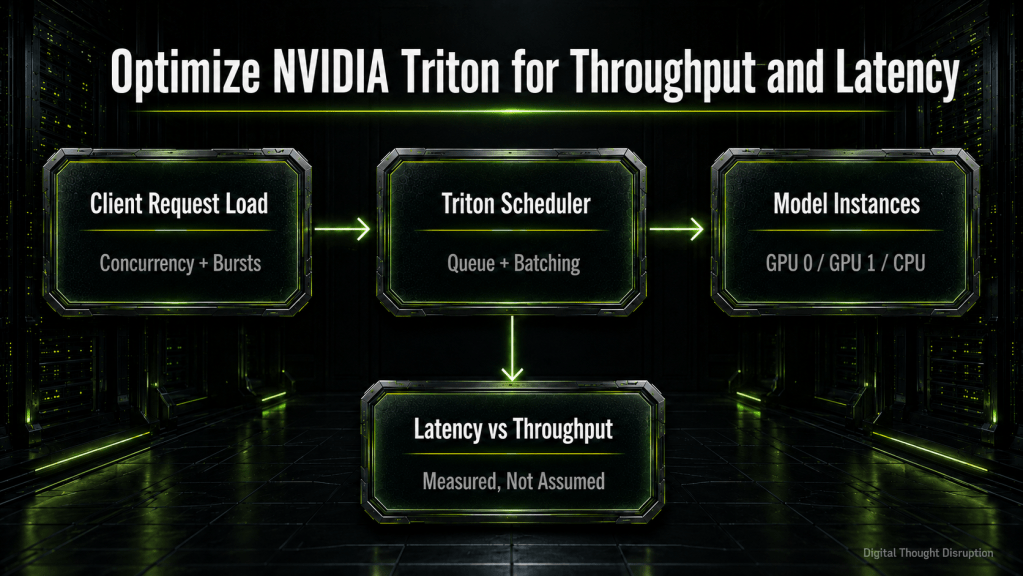
Before changing configuration, it helps to understand where latency is introduced. Triton routes each request to the scheduler associated with the requested model. That scheduler may execute the request independently, combine it into a dynamic batch, or route it through the sequence batcher. The resulting work is assigned to an available model instance, which executes through the configured backend on a GPU or CPU.
The important point is that batching delay, scheduler queue time, model-instance availability, data movement, and model compute are different parts of the request path.
What the diagram should make clear is that adding a second model instance does not make the model itself faster. It creates another execution slot. Likewise, dynamic batching does not eliminate queueing. It deliberately uses available concurrency to form more efficient batches, and an optional queue delay can hold requests briefly while a batch forms.
Prerequisites and Test Assumptions
Use a staging environment that matches production closely enough for the measurements to matter. At minimum, keep the following stable during a comparison:
- Triton server release and backend versions.
- GPU model, GPU count, MIG layout if used, driver, CUDA, and container runtime.
- Model artifact, precision, optimization profiles, and input shapes.
- CPU allocation, memory, NUMA placement, and storage path.
- Network path between the load generator and Triton.
- Input dataset, request sizes, request distribution, and test duration.
- Any other models sharing the same node or GPU.
You also need a written performance contract. A useful starting point looks like this:
| Metric | Example target | Why it matters |
|---|---|---|
| p50 latency | Under 8 ms | Normal user experience |
| p95 latency | Under 15 ms | Sustained busy-period behavior |
| p99 latency | Under 20 ms | Tail-latency protection |
| Minimum throughput | 1,500 inferences per second | Required service capacity |
| GPU memory ceiling | 80 percent | Headroom for bursts and co-resident models |
| Error rate | Below 0.1 percent | Stability under load |
Replace these numbers with your application requirements. Do not copy them into production as universal Triton targets.
Build a Versioned Triton Model Repository
Triton expects each model to have its own directory, an optional or required config.pbtxt, and at least one numerically named version directory. The model file name depends on the backend. An ONNX model commonly uses model.onnx, a TensorRT plan uses model.plan, and a Python backend model commonly uses model.py.
A practical repository for optimization work can look like this:
model-repository/
+-- image_classifier/
    +-- config.pbtxt
    +-- configs/
    |   +-- baseline.pbtxt
    |   +-- latency.pbtxt
    |   +-- throughput.pbtxt
    +-- 1/
    |   +-- model.onnx
    +-- 2/
        +-- model.onnx
The version directories should represent immutable model artifacts. Configuration candidates should also be version controlled, even when they are stored outside the live repository during testing. This prevents a benchmark result from becoming detached from the exact scheduler and instance configuration that produced it.
Use a naming convention that captures intent rather than claiming that one configuration is universally best. Names such as latency, balanced, and throughput are more useful than fast or optimized because performance depends on the workload and service objective.
Establish a Minimal Baseline Configuration
Start with a configuration that is valid, explainable, and intentionally conservative. The following example assumes a stateless ONNX image-classification model that supports batching. It creates one GPU model instance, enables dynamic batching with no artificial delay, and pins the served version to version 1 during the baseline test.
name: "image_classifier"
platform: "onnxruntime_onnx"
max_batch_size: 16

input [
  {
    name: "input"
    data_type: TYPE_FP32
    dims: [ 3, 224, 224 ]
  }
]

output [
  {
    name: "probabilities"
    data_type: TYPE_FP32
    dims: [ 1000 ]
  }
]

instance_group [
  {
    count: 1
    kind: KIND_GPU
    gpus: [ 0 ]
  }
]

dynamic_batching { }

version_policy {
  specific {
    versions: [ 1 ]
  }
}
Change the model name, platform, tensor names, data types, dimensions, batch size, GPU IDs, and version policy to match your model. The model must genuinely support the configured batch dimension. Setting max_batch_size to a positive value does not add batching support to an artifact that was exported without it.
The empty dynamic_batching block is deliberate. Triton will form batches as large as possible up to max_batch_size without waiting for an additional configured delay. This gives you a clean dynamic-batching baseline before adding queue delay or preferred batch sizes.
Choose the Correct Batcher
Dynamic batching and sequence batching solve different scheduling problems. They should not be treated as interchangeable optimization modes.
| Criterion | Dynamic batching | Sequence batching |
|---|---|---|
| Model behavior | Stateless requests | Stateful request sequences |
| Request relationship | Independent requests can be combined | Requests in a sequence must retain instance affinity |
| Common use case | Classification, detection, embeddings, stateless transforms | Recurrent state, session state, ordered multi-request inference |
| Main tuning concern | Batch formation, delay, concurrency, instance count | Sequence slots, sequence duration, idle timeout, affinity |
| Failure if misused | Unnecessary latency or poor utilization | Incorrect state routing or broken sequence behavior |
For a stateless model, start with dynamic batching. For a stateful model that maintains information between calls, use sequence batching so requests with the same sequence are routed to the same model instance.
Do not enable sequence batching only because requests arrive in order. Sequence batching is for model state and sequence affinity, not for ordinary client ordering. If a stateless API needs responses returned in request order, evaluate the dynamic batcher’s ordering behavior separately and confirm that the extra constraint is necessary.
Tune Dynamic Batching in Controlled Steps
Dynamic batching usually provides the largest first improvement when a GPU model receives multiple independent requests. The safe method is to change one dimension at a time and retain the full latency distribution.
Start with no configured delay
The initial test should use:
dynamic_batching { }
This allows Triton to combine requests that are already available when a model instance becomes free. It does not intentionally hold a request to wait for more work.
Add a small queue delay only when it earns its budget
If the workload does not naturally produce efficient batches, test a small delay:
dynamic_batching {
  max_queue_delay_microseconds: 200
}
The value is a maximum batching delay in microseconds, not a general request timeout and not a promise that every request will wait that long. Triton can dispatch sooner when a suitable batch forms. Increase the delay only when the throughput gain is meaningful and p95 and p99 latency remain inside the service objective.
A useful sweep might test 0, 50, 100, 200, 500, and 1,000 microseconds. The correct range depends on the model’s execution time and the application’s latency budget. For a model with a strict single-digit millisecond target, a one-millisecond batching delay may be unacceptable. For an asynchronous pipeline measured in hundreds of milliseconds, it may be insignificant.
Separate batch formation delay from queue admission control
max_queue_delay_microseconds controls how long Triton may wait while trying to form a better batch. A queue policy controls what happens when requests remain queued too long or the queue becomes too large. These are separate controls and should be tested separately.
The following example allows a 200-microsecond batching delay, limits the scheduler queue to 256 requests, and rejects requests that exceed a 20-millisecond queue timeout:
dynamic_batching {
  max_queue_delay_microseconds: 200

  default_queue_policy {
    timeout_action: REJECT
    default_timeout_microseconds: 20000
    allow_timeout_override: false
    max_queue_size: 256
  }
}
Set the queue timeout below the application’s end-to-end deadline so Triton does not spend the entire request budget waiting for capacity that is unlikely to become available. Confirm that callers handle the rejection path correctly. A bounded queue protects the service from unlimited backlog, but it does not replace upstream admission control, autoscaling, or load shedding.
Avoid preferred batch sizes by default
Triton can be configured with preferred batch sizes, but most models should first be tested without them. Preferred batch sizes are most useful when the backend has known performance discontinuities, such as TensorRT optimization profiles that perform materially better at specific batch sizes.
Do not add [4, 8, 16] simply because those numbers look efficient. Let the measurements show whether a specific preferred batch size produces a better operating point.
Configure Model Instances for Parallel Execution
By default, a model generally receives one execution instance per available GPU when an explicit instance group is not provided. Setting instance_group makes placement and parallelism explicit.
The following configuration creates two instances of the same model on GPU 0:
instance_group [
  {
    count: 2
    kind: KIND_GPU
    gpus: [ 0 ]
  }
]
Two instances allow two batches to execute concurrently when the backend and GPU can benefit from parallel work. This can improve throughput for small models, models that do not fully occupy the GPU, and workloads with enough concurrency to keep both instances busy.
More instances are not automatically better. Each instance can consume additional GPU memory, backend state, execution contexts, CPU threads, and host memory. Too many instances can reduce performance by creating contention, increasing memory pressure, or fragmenting work that would have formed efficient batches.
Test instance counts of 1, 2, and possibly 3 or 4. Stop increasing the count when one of the following occurs:
- Throughput stops improving materially.
- p95 or p99 latency rises.
- GPU memory headroom becomes unsafe.
- Queue time falls but compute time rises because instances are competing.
- Other models on the GPU experience regressions.
- Error rates or out-of-memory events appear during sustained load.
Understand Concurrent Model Execution
Triton can execute different models, and multiple instances of the same model, concurrently. This is useful when one server hosts preprocessing, inference, reranking, classification, or several independent applications.
The tuning problem changes when models share resources. A configuration that wins in an isolated benchmark may lose when another model is using GPU compute, memory bandwidth, copy engines, CPU threads, or pinned memory.
Profile co-resident models together when they will run together in production. Watch for one model gaining throughput while another loses its latency objective. If simultaneous execution risks exhausting memory, consider resource separation, placement changes, or Triton’s rate-limiting controls rather than relying on optimistic isolated measurements.
Place Models on CPUs and GPUs Deliberately
Triton can run supported models on GPUs or CPUs, but placement should follow workload characteristics rather than a blanket rule.
A CPU instance group is expressed as follows:
instance_group [
  {
    count: 4
    kind: KIND_CPU
  }
]
CPU placement can be appropriate for lightweight preprocessing, small classical models, low-rate models, or services where GPU transfer and scheduling overhead outweigh acceleration. GPU placement is usually appropriate for compute-intensive neural networks, TensorRT engines, and models that benefit from larger batches and accelerator-specific execution.
Use these decision criteria:
| Question | CPU may fit | GPU may fit |
|---|---|---|
| Is the model small and low volume? | Often | Sometimes unnecessary |
| Does the model use GPU-specific artifacts? | No | Yes |
| Does batching create a large efficiency gain? | Limited or backend-dependent | Often |
| Is host-to-device transfer a large part of latency? | Avoids transfer | May still win at scale |
| Is GPU capacity reserved for larger models? | Useful for offload | Competes for scarce capacity |
| Is tail latency sensitive to shared GPU contention? | Can isolate the path | Requires careful placement |
Do not infer placement from model type alone. Measure the complete request path, including preprocessing, serialization, data copies, and response handling. A faster kernel does not guarantee a faster service.
Load Test with Realistic Concurrency and Inputs
Perf Analyzer can search concurrency levels or request rates and report throughput and latency. It can also use user-provided input data rather than random tensors. Production-oriented testing should use representative tensor values, shapes, payload sizes, and request patterns.
A concurrency sweep for a stateless model can look like this:
perf_analyzer \
  -m image_classifier \
  --protocol grpc \
  --input-data /workspace/data/requests.json \
  --concurrency-range 1:64:4 \
  --percentile 99 \
  --measurement-mode count_windows \
  --measurement-request-count 200
This command tests increasing client concurrency, uses a representative JSON dataset, and reports the 99th percentile. Change the model name, protocol, input path, concurrency range, and measurement count for your environment.
A request-rate test can better represent an externally driven service:
perf_analyzer \
  -m image_classifier \
  --protocol grpc \
  --input-data /workspace/data/requests.json \
  --request-rate-range 100:2000:100 \
  --request-distribution poisson \
  --latency-threshold 20 \
  --percentile 99
Poisson request timing can resemble variable real-world arrivals more closely than perfectly constant dispatch. For a known traffic trace, use an explicit schedule or request-interval input so the test includes the same bursts and idle periods seen by the service.
Run both open-loop and closed-loop tests
A concurrency test is effectively client-limited: each client keeps a configured number of requests in flight. A request-rate test is arrival-limited: requests are generated according to a target rate even when the server slows down.
Use both when possible. Concurrency testing is useful for finding saturation behavior and maximum sustainable in-flight work. Request-rate testing is useful for understanding what happens when traffic arrives independently of server response time.
Warm the model before recording results
The first requests may include model initialization, memory allocation, cache population, or backend warm-up effects. Use Triton model warmup where appropriate or send a warm-up phase before measuring. Keep the warm-up method consistent across every candidate configuration.
Test long enough to expose instability
A short benchmark can miss thermal behavior, memory growth, periodic garbage collection, background interference, and queue accumulation. Use a quick sweep to identify candidates, then run sustained tests for the finalists.
Read the Latency Breakdown Correctly
Perf Analyzer reports client-observed latency and server-side timing. The server latency includes queue, compute, and protocol-related overhead components.
Queue time is especially important. It represents time spent waiting in Triton’s inference scheduling queue for a model instance to become available. High queue time can mean:
- The batching delay is too large.
- The model has too few execution instances.
- The request rate is beyond sustainable capacity.
- Another model is consuming the shared execution resource.
- The backend or GPU is slower under concurrency than expected.
Compute time includes model execution and relevant data movement to and from the GPU. If compute time dominates and GPU utilization is already high, adding more instances may increase contention. If queue time dominates while compute time and utilization remain moderate, another instance or better batching may help.
Use this interpretation table during tests:
| Observation | Likely direction to investigate |
|---|---|
| Low queue, low compute, low throughput | Load generator is too light or client overhead is limiting |
| Rising queue, stable compute | Capacity limit, too few instances, or deliberate batch delay |
| Rising compute with more instances | GPU contention or memory-bandwidth pressure |
| Higher throughput and stable p99 | Candidate improvement |
| Higher throughput and failed p99 | Not acceptable for a latency-bound service |
| Good isolated results, poor shared results | Co-resident model interference |
Do not optimize only the average. Average latency can remain attractive while a small percentage of requests experience severe queueing.
Profile Candidate Configurations with Model Analyzer
Manual tuning is useful for understanding the system, but the search space grows quickly. A model with several batch sizes, queue delays, instance counts, GPU placements, and concurrency levels can produce hundreds of combinations.
Model Analyzer can profile candidate configurations, apply constraints, and generate throughput-versus-latency reports. Its quick search mode can explore max batch size, dynamic batching, and instance-group settings without exhaustively running every combination.
The following example constrains p99 latency to 20 milliseconds and asks Model Analyzer to maximize throughput across a bounded search space:
model_repository: /models
run_config_search_mode: quick
run_config_search_min_concurrency: 1
run_config_search_max_concurrency: 64
run_config_search_min_model_batch_size: 1
run_config_search_max_model_batch_size: 16
run_config_search_min_instance_count: 1
run_config_search_max_instance_count: 4

profile_models:
  image_classifier:
    perf_analyzer_flags:
      percentile: 99
      input-data: /workspace/data/requests.json
    constraints:
      perf_latency_p99:
        max: 20
    objectives:
      - perf_throughput
Run the profile with:
model-analyzer profile -f /workspace/model-analyzer.yaml
This is a candidate-discovery tool, not an automatic production decision. Review the generated configurations, memory use, throughput-versus-latency plots, test logs, and any failed runs. Then retest the best candidates with the production-like load pattern and co-resident models.
Model Analyzer’s search result is only as trustworthy as the search boundaries and input workload. If the production service regularly reaches concurrency 200, a search capped at 64 cannot prove production fitness. If the production model receives multiple dynamic shapes, a single fixed shape is not representative.
Balance Latency and Throughput with an Operating Envelope
There is rarely one configuration that simultaneously minimizes latency and maximizes throughput. A more useful output is an operating envelope that defines acceptable behavior across a range of load.
A balanced configuration should answer these questions:
- What is the maximum sustainable request rate before p99 fails?
- At what concurrency does queue time begin to grow continuously?
- How much throughput is gained for each additional microsecond of batching delay?
- How much GPU memory does each extra instance consume?
- Does the configuration remain stable when neighboring models are busy?
- What happens during bursts above the planned operating point?
- At what threshold should the platform scale out instead of increasing local parallelism?
The goal is not to run every GPU at maximum utilization. The goal is to provide predictable service behavior with enough headroom to handle normal variance and recover from failures.
Treat config.pbtxt as production code. A scheduler change can alter latency, memory use, ordering, queue behavior, and failure modes without changing the model artifact.
A safe promotion workflow looks like this:
Use explicit promotion gates
A configuration should not be promoted unless it passes all required gates:
| Gate | Minimum evidence |
|---|---|
| Model load | Model reaches ready state without backend or shape errors |
| Functional correctness | Known inputs produce expected outputs |
| Latency | p95 and p99 remain inside the service objective |
| Throughput | Meets minimum sustained capacity |
| Queue behavior | Queue time is bounded and recovers after bursts |
| Resource use | GPU memory, CPU, and host memory stay within limits |
| Shared-node behavior | Co-resident models retain their objectives |
| Stability | Sustained test completes without errors or growth |
| Rollback | Previous repository and configuration can be restored quickly |
Prefer explicit model control for controlled changes
For production systems that need runtime model management, use a controlled load and unload process with health checks and deployment orchestration. Repository polling can observe partially written repository changes and is not a safe substitute for an atomic promotion workflow.
A robust pattern is to build a complete immutable model repository or container image, deploy it beside the current Triton instance, load and validate the candidate, shift a small percentage of traffic, and then increase traffic only while the service-level indicators remain healthy.
Keep rollback independent of the failed candidate
Rollback should restore both the model artifact and its configuration. Keep the previous image, repository version, deployment manifest, and performance evidence. Do not assume that changing only max_queue_delay_microseconds back to its old value restores the previous state if the model version, instance placement, or backend also changed.
Common Optimization Failures
Dynamic batching is enabled but throughput does not improve
The client may not be generating enough concurrent work, the model may not support batching correctly, input shapes may prevent requests from combining, or the model may already saturate the GPU at batch size 1. Confirm observed batch sizes and test with realistic concurrency.
Queue time rises after adding a batching delay
Some increase is expected because requests may wait for batch formation. The configuration is only useful if the throughput gain justifies that delay and tail latency remains within the objective. Reduce or remove the delay when p99 fails.
More instances reduce performance
The model instances may be contending for GPU compute, memory bandwidth, copy engines, CPU threads, or backend locks. Return to the lower count and test whether scale-out across replicas is more predictable.
GPU utilization is low during the benchmark
The load generator may be too close to the server, too slow, CPU-bound, or using unrealistic input preparation. Network transfer, serialization, and synchronous client behavior can also limit request generation. Validate the load generator before changing Triton.
CPU placement looks faster in a small test
A low-concurrency test may favor CPU execution because it avoids transfer and scheduling overhead. Repeat the test at expected production rates and include CPU contention from the rest of the application stack.
Model Analyzer selects an impractical winner
The search objective may not include the real p99 limit, memory ceiling, shared-model workload, or request distribution. Tighten the constraints and rerun the finalists manually under a representative environment.
A production change loads inconsistently
The repository may have been modified in place while Triton was watching it. Build and validate complete artifacts before promotion, use explicit deployment control, and avoid exposing partial repository changes.
Practical Tuning Sequence
Use this sequence to avoid changing too many variables at once:
- Validate model correctness and repository layout.
- Record a batch-size-1, one-instance latency baseline.
- Enable default dynamic batching for a stateless model.
- Sweep realistic concurrency and request rates.
- Test a small range of queue delays.
- Test instance counts while monitoring memory and compute time.
- Test CPU versus GPU placement only where the backend supports both.
- Repeat tests with co-resident models and production-like bursts.
- Use Model Analyzer to explore a bounded configuration space.
- Retest finalists manually and run a sustained soak.
- Promote through canary traffic with rollback ready.
- Re-profile after model, backend, GPU, driver, or workload changes.
Conclusion
Triton performance optimization works best as an engineering control loop, not a one-time configuration exercise. Build an immutable model repository, define the service objective, establish a conservative baseline, and measure the request path before increasing parallelism.
Dynamic batching is usually the right first scheduler for stateless models, while sequence batching is required for stateful sequences. Model instances create parallel execution capacity, but they also consume memory and can introduce contention. Queue delay can improve batch efficiency, but it spends latency budget. CPU and GPU placement should be decided from end-to-end measurements rather than assumptions about acceleration.
Perf Analyzer provides the evidence needed to understand throughput, latency, queueing, and saturation. Model Analyzer can narrow a large configuration space, but its output still needs production-like validation. The final configuration should be the one that meets p95 and p99 targets, sustains required throughput, preserves resource headroom, and remains reversible under change control.
The best Triton configuration is not the one with the highest benchmark number. It is the one that remains predictable when production traffic stops behaving like a benchmark.
